Synthesis and Characterization of Molecular Beacons
Table of contents
- Materials
- Synthesis and purification
- Characterization of molecular beacons
- Real-time monitoring of polymerase chain reactions
- Literature
1. Materials
Recently, controlled-pore glass columns that introduces a dabcyl moiety at the 3' end of an oligonucleotide have become available, which enable the synthesis of molecular beacons completely on a DNA synthesizer. Alternatively, the starting material for the synthesis of molecular beacons is an oligonucleotide that contains a sulfhydryl group at its 5' end and a primary amino group at its 3' end. Dabcyl is coupled to the primary amino group utilizing an amine-reactive derivative of dabcyl. The oligonucleotides that are coupled to dabcyl are then purified. The protective trityl moiety is then removed from the 5'-sulfhydryl group and a fluorophore is introduced in its place, using an iodoacetamide derivative.
Equipment
– High-pressure liquid chromatograph
– Spectrofluorometer
– Spectrofluorometric thermal cycler with a capacity to monitor fluorescence in real time
Buffers
– 0.1 M sodium bicarbonate, pH 8.5
– 0.2 M sodium bicarbonate, pH 9.0
– HPLC Buffer A: 0.1 M triethylammonium acetate, pH 6.5, filtered and degassed
– HPLC Buffer B: 0.1 M triethylammonium acetate in 75% acetonitrile, pH 6.5, filtered and degassed
– TE buffer: 1 mM EDTA, 10 mM Tris-HCl, pH 8.0
– Molecular beacon buffer: 1 mM MgCl2, 20 mM Tris-HCl, pH 8.0
2. Synthesis and purification
2.1. Coupling of dabcyl
- Dissolve 50-250 nanomoles of dry oligonucleotide in 500 µl of 0.1 M sodium bicarbonate,
pH 8.5. Dissolve about 20 mg of dabcyl (4-(4'-dimethylaminophenylazo)benzoic acid)
succinimidyl ester (Molecular Probes) in 100 µl N,N-dimethylformamide and add to
a stirring solution of the oligonucleotide in 10-µl aliquots at 20-minute intervals.
Continue stirring for at least 12 hours.
- Remove particulate material by spinning the mixture in a microcentrifuge for one minute at
10,000 rpm. In order to remove unreacted dabcyl, pass the supernatant through a
gel-exclusion column. Equilibrate a Sephadex G-25 column (NAP-5, Pharmacia) with
buffer A, load the supernatant and elute with 1 ml buffer A. Filter the eluate through
a 0.2 µm Centrex MF-0.4 filter (Schleicher & Schuell).
- Purify the oligonucleotides by high-pressure liquid chromatography (HPLC) on a C-18 reverse-phase column (Waters), utilizing a linear
elution gradient of 20 to 70% buffer B in buffer A and run for 25 minutes at a flow rate of
1 ml/min. Monitor the absorption of the elution stream at 260 nm and 491 nm. A
typical chromatogram is shown in Figure 1. Collect the peak that absorbs in both
wavelengths, which contains oligonucleotides with a protected sulfhydryl group at their
5'-ends and dabcyl at their 3'-ends (peak D).
- Precipitate the collected material with ethanol and salt, and spin in a centrifuge for 10 minutes at 10,000 rpm, discard the supernatant, dry the pellet and dissolve it in 250 µl buffer A.
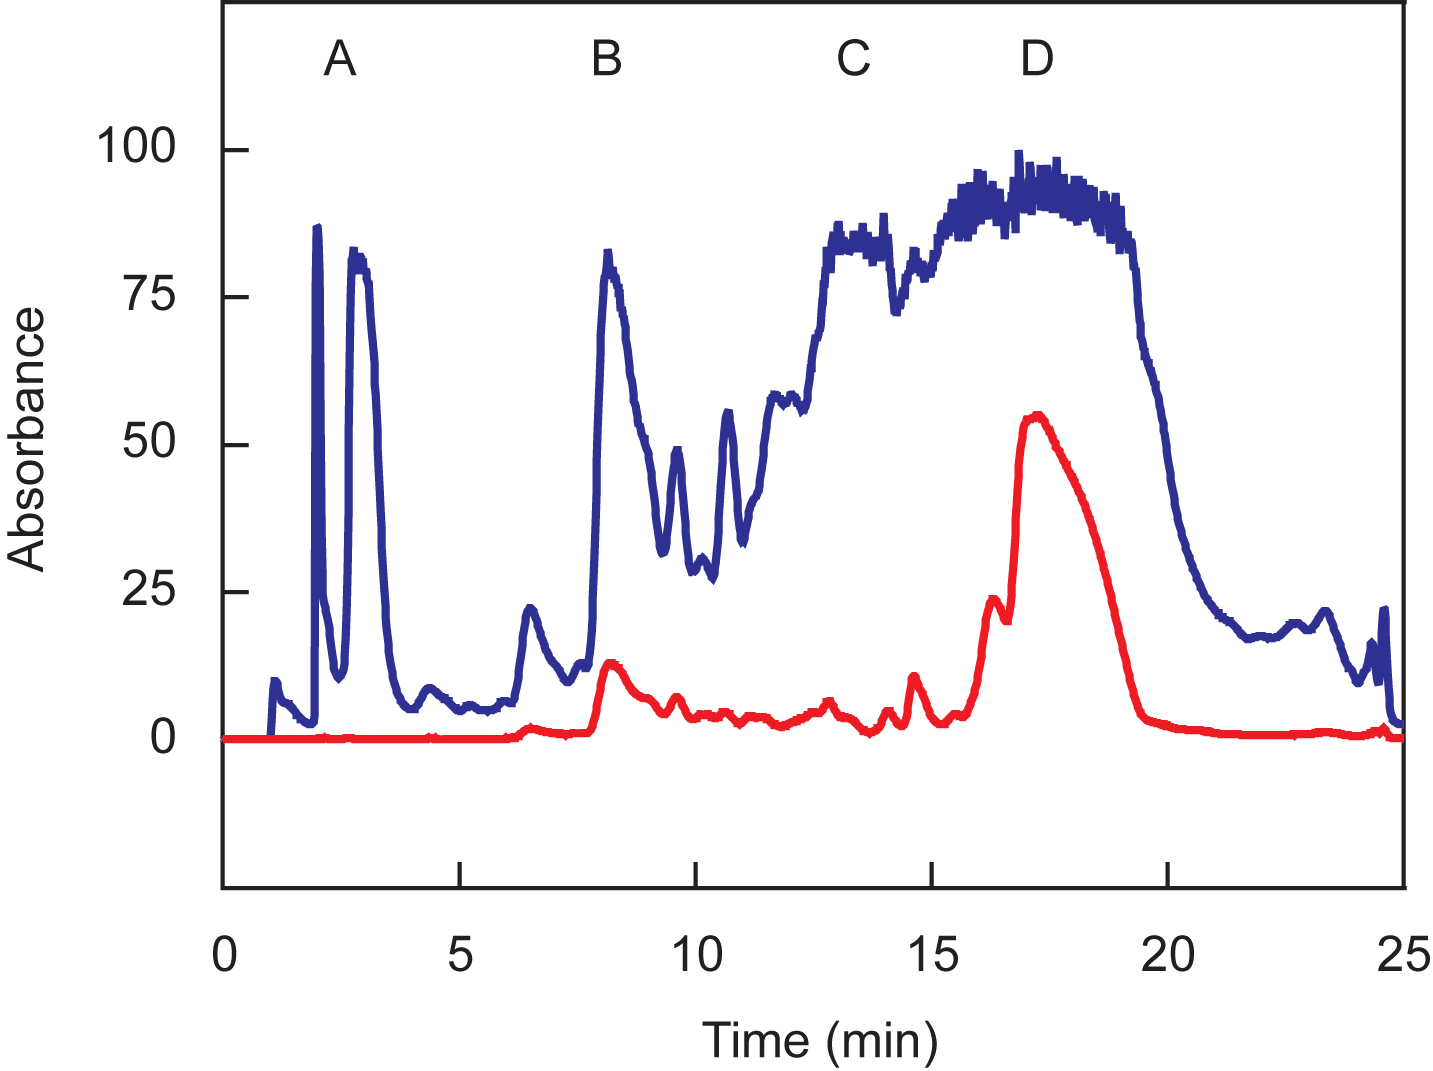
Figure 1. Chromatographic separation of oligonucleotides coupled to dabcyl. The blue line represents absorption at 260 nm and the red line represents absorption at 491 nm. The oligonucleotides in peaks A and B do not contain trityl moieties, whereas the oligonucleotides in peaks C and D are protected by trityl moieties. The oligonucleotides in peaks B and D are coupled to dabcyl, whereas the oligonucleotides in peaks A and C are not coupled to dabcyl. Peak D should be collected.
2.2. Coupling of fluorophore
- In order to remove the trityl moiety, add 10 µl of 0.15 M silver nitrate and
incubate for 30 minutes. Add 15 µl of 0.15 M dithiothreitol to this mixture and shake for 5
minutes. Spin for 2 minutes at 10,000 rpm and transfer the supernatant to a new tube.
Dissolve about 40 mg 5-iodoactamidofluorescein (Molecular Probes) in 250 µl of
0.2 M sodium bicarbonate, pH 9.0, and add it to the supernatant. Incubate the mixture
for 90 minutes. Each of these solutions should be prepared just before use.
- Remove excess fluorescein from the reaction mixture by gel exclusion
chromatography and purify the oligonucleotides coupled to fluorescein by HPLC,
following the instructions in steps 2 and 3 of the previous section. A sample
chromatogram is shown in Figure 2. Collect the fractions corresponding to peak F, which absorb at wavelengths 260 nm and
491 nm and are fluorescent when observed with an ultraviolet lamp in a dark room. If a different
fluorophore is coupled in place of fluorescein, its maximum absorption wavelength
should be used instead of 491 nm.
- Precipitate the collected material and dissolve the pellet in 100 µl TE buffer. Determine the absorbance at 260 nm and estimate the yield (1 OD260= 33 µg/ml).
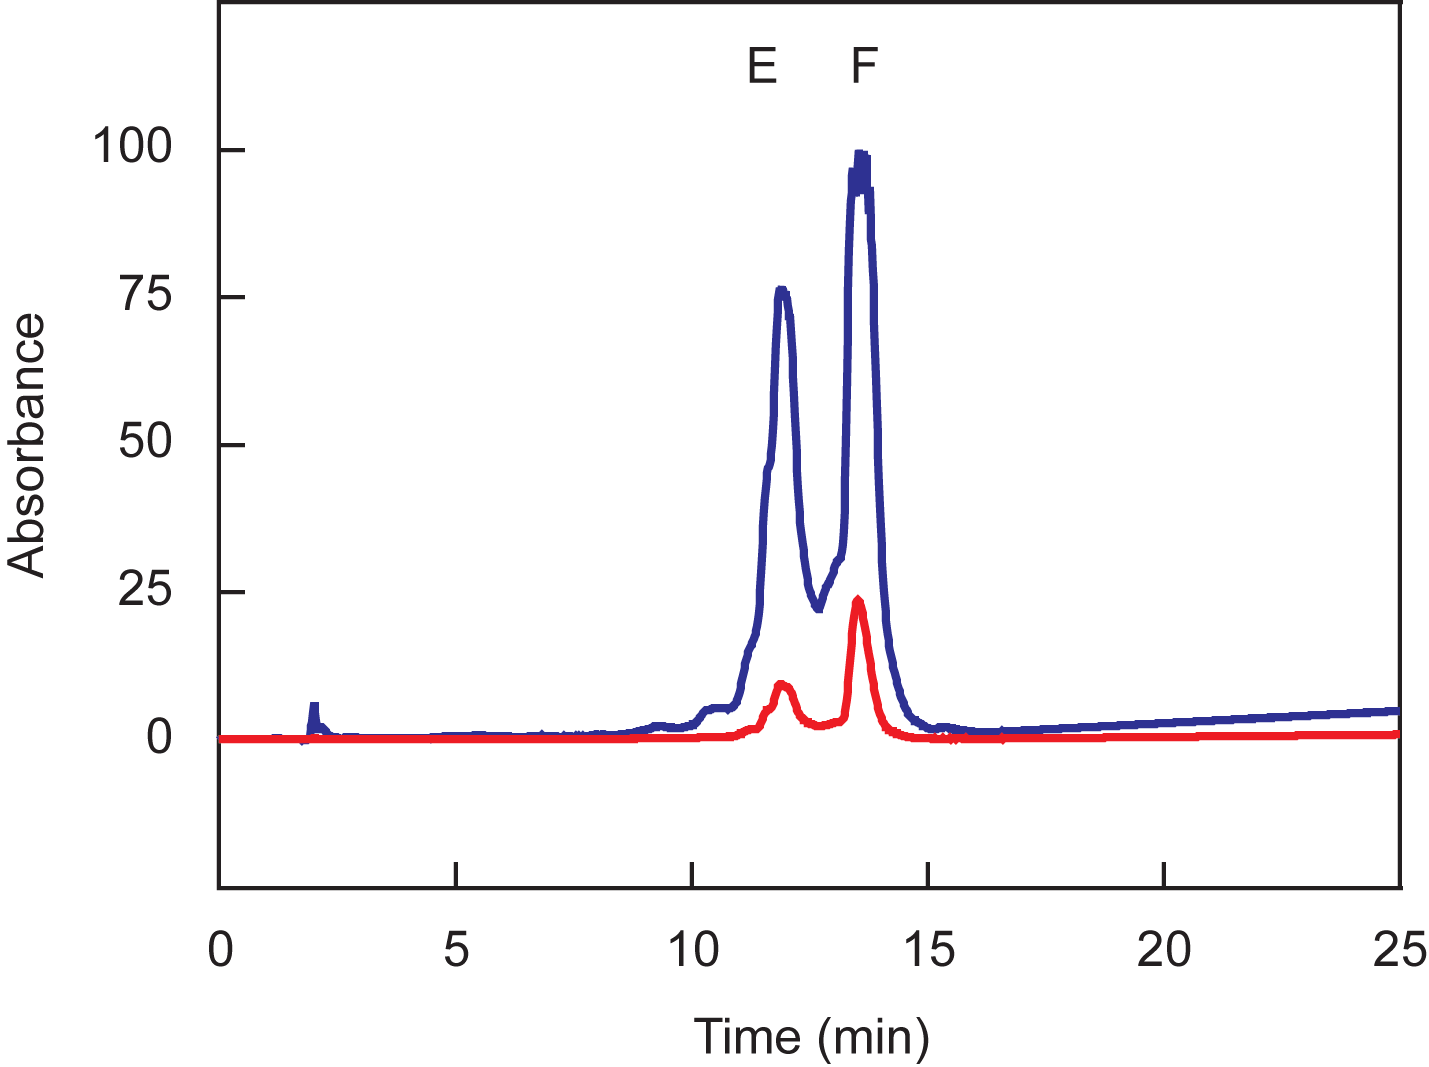
Figure 2. Chromatographic separation of oligonucleotides coupled to both dabcyl and fluorescein. The blue line represents absorption at 260 nm and the red line represents absorption at 491 nm. The oligonucleotides present in peak E are not coupled to fluorescein, whereas the oligonucleotides in peak F are coupled to fluorescein. Peak F should be collected.
2.3. Automated synthesis
- Use a controlled-pore glass column to introduce dabcyl (Biosearch Technologies or Glen Research) at the 3' end of the oligonucleotide during automated synthesis. At the 5' end of the oligonucleotide, either a thiol or an amino modifier (Glen Research) can be introduced for a subsequent coupling to a fluorophore, or a fluorophore can directly be introduced during automated synthesis using a phosphoramidite. The 5' modifiers and fluorophores should remained protected with a trityl moiety during the synthesis. Perform post-synthetic steps as recommended by the manufacturer of the DNA synthesizer. Dissolve the oligonucleotide in 600 µl Buffer A.
- When the fluorophore is to be introduced manually, purify the oligonucleotide protected with a trityl moiety. Remove the trityl moiety from the purified oligonucleotide and continue with the coupling of the fluorophore, as described above.
- When a 5' fluorophore is introduced via automated synthesis, purify the oligonucleotide protected with the trityl moiety and then remove the trityl moiety from the purified oligonucleotide. Precipitate the molecular beacon with ethanol and salt and dissolve the pellet in 100 µl TE buffer. Determine the absorbance at 260 nm and estimate the yield.
3. Characterization of molecular beacons
3.1. Signal to background ratio
- Determine the fluorescence of 200 µl of molecular beacon buffer solution (Fbuffer), using 491 nm as the excitation wavelength and 515 as the emission wavelength.
If the fluorophore is not fluorescein, choose wavelengths that are optimal for the fluorophore in the molecular beacon.
- Add 10 µl of 1 µM molecular beacon to this solution and record the new level of fluorescence (Fclosed).
- Add a two-fold molar excess of a complementary oligonucleotide target and monitor the rise in fluorescence until it reaches a stable level (Fopen).
- Calculate the signal-to-background ratio as (Fopen-Fbuffer)/(Fclosed-Fbuffer).
3.2. Thermal denaturation profiles
- Prepare two tubes containing 50 µl of 200 nM molecular beacon dissolved in 3.5 mM MgCl2 and 10 mM Tris-HCl, pH 8.0 and add the oligonucleotide target to one of the tubes at a final concentration of 400 nM.
- Determine the fluorescence of each solution as a function of temperature using a spectrofluorometric thermal cycler. Decrease the temperature of these tubes from 80 °C to 10 °C in 1 °C steps, with each hold lasting one minute, while monitoring the fluorescence during each hold.
3.3. Results
An example of a hybridization reaction performed for the determination of the signal-to-background ratio is shown in Figure 3. The signal-to-background ratio in this example was 190. Usually the ratio ranges from 30 to 200. An example of a thermal denaturation profile is shown in Figure 4. The probe-target hybrid denatures at 58 °C and the stem of the molecular beacon denatures at 64 °C. In the range of 10 °C to 50 °C, the free probe has very little fluorescence, whereas the target-bound form is fluorescent. The sequence of the molecular beacon used throughout this section is: fluorescein-5'- GCG AGC TAG GAA ACA CCA AAG ATG ATA TTT GCT CGC -3'-dabcyl, where underlines identify the arm sequences.
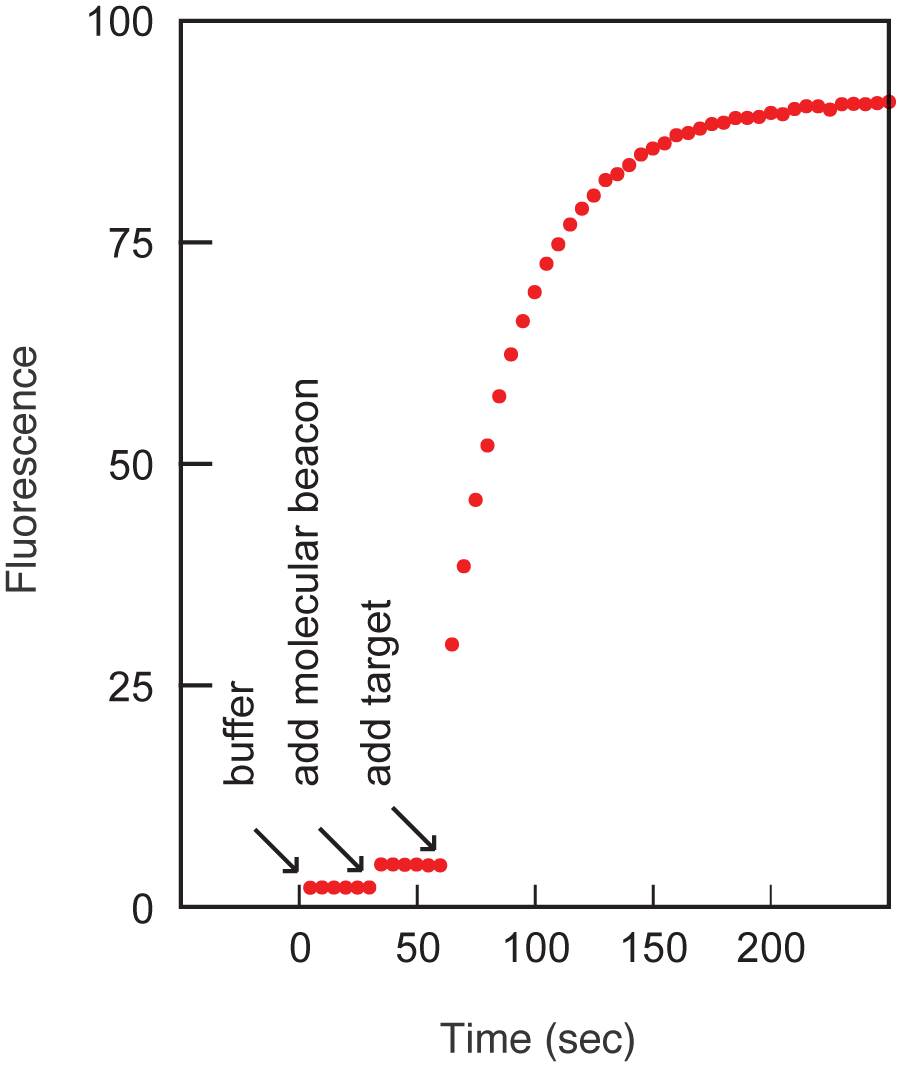
Figure 3. The spontaneous fluorogenic response of molecular beacons to the addition of target. The first segment of the data is due to the fluorescence of the buffer, the second segment is due to the fluorescence of the buffer containing the molecular beacons, and the third segment shows the increase in fluorescence that occurs upon the addition of target oligonucleotides.
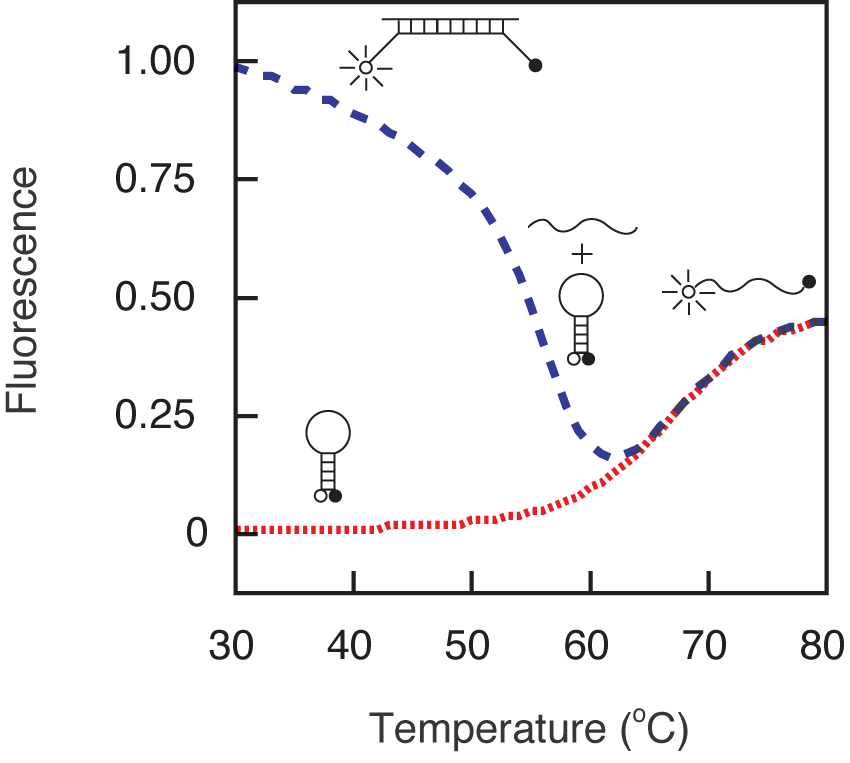
Figure 4. Thermal denaturation profiles of a molecular beacon (red-dotted line) and the hybrid formed between the molecular beacons and its oligonucleotide target (blue-dashed line). The profiles indicate that this molecular beacon can be used below 55 °C.
4. Real-time monitoring of polymerase chain reactions
Utilize molecular beacons that are complementary to a sequence in the middle of the expected amplicon. The length of their arm sequences should be chosen so that a stem is formed at the annealing temperature of the polymerase chain reaction. The length of the loop sequence should be chosen so that the probe-target hybrid is stable at the annealing temperature. Whether a molecular beacon actually exhibits these design features is determined by obtaining thermal denaturation profiles, as detailed in the previous section. Molecular beacons with appropriate thermal denaturation characteristics are included in each reaction at a concentration similar to the concentration of the primers. During the denaturation step, the molecular beacons assume a random-coil configuration and fluoresce. As the temperature is lowered to allow annealing of the primers, stem hybrids form rapidly, preventing fluorescence. However, at the annealing temperature, molecular beacons also bind to the amplicons, undergo conformational reaorganization, and generate fluorescence. When the temperature is raised to allow primer extension, the molecular beacons dissociate from their targets and do not interfere with polymerization. A new hybridization takes place in the annealing step of every cycle, and the intensity of the resulting fluorescence indicates the amount of accumulated amplicon. In the procedure below, the synthesis of an 84-nucleotide-long amplicon is monitored with the same molecular beacon whose synthesis and characterization was described in previous section.
4.1. Procedure
- Set up six 50 µl reactions so that each contains a different number of targets (1,000,000; 100,000; 10,000; 1,000; 100; 10; 1 copies),
0.34 µM molecular beacon, 1 µM of each primer, 2.5 units of Amplitaq Gold DNA
polymerase (Perkin Elmer), 0.25 mM of each deoxyribonucleotide, 3.5 mM MgCl2,
50 mM KCl, and 10 mM Tris-HCl, pH 8.0.
- Program the spectrofluorometric thermal cycler to incubate the tubes at 95 °C for 10 min to activate the Amplitaq Gold DNA polymerase, followed by 40 cycles of 30 sec at 95 °C, 60 sec at 50 °C, and 30 sec at 72 °C. Monitor fluorescence during the 50 °C annealing steps.
4.2. Results
Figure 5 shows the level of fluorescence as a function of the number of temperature cycles completed.
The level of fluorescence is proportional to the amount of amplicons present in each cycle. The
reaction that did not contain any template, did not show any rise in fluorescence. The number of temperature
cycles required before the fluorescence signal becomes detectable over the background is inversely
proportional to the logarithm of the initial number of template molecules. This
relationship is true over a wide range of template concentrations.
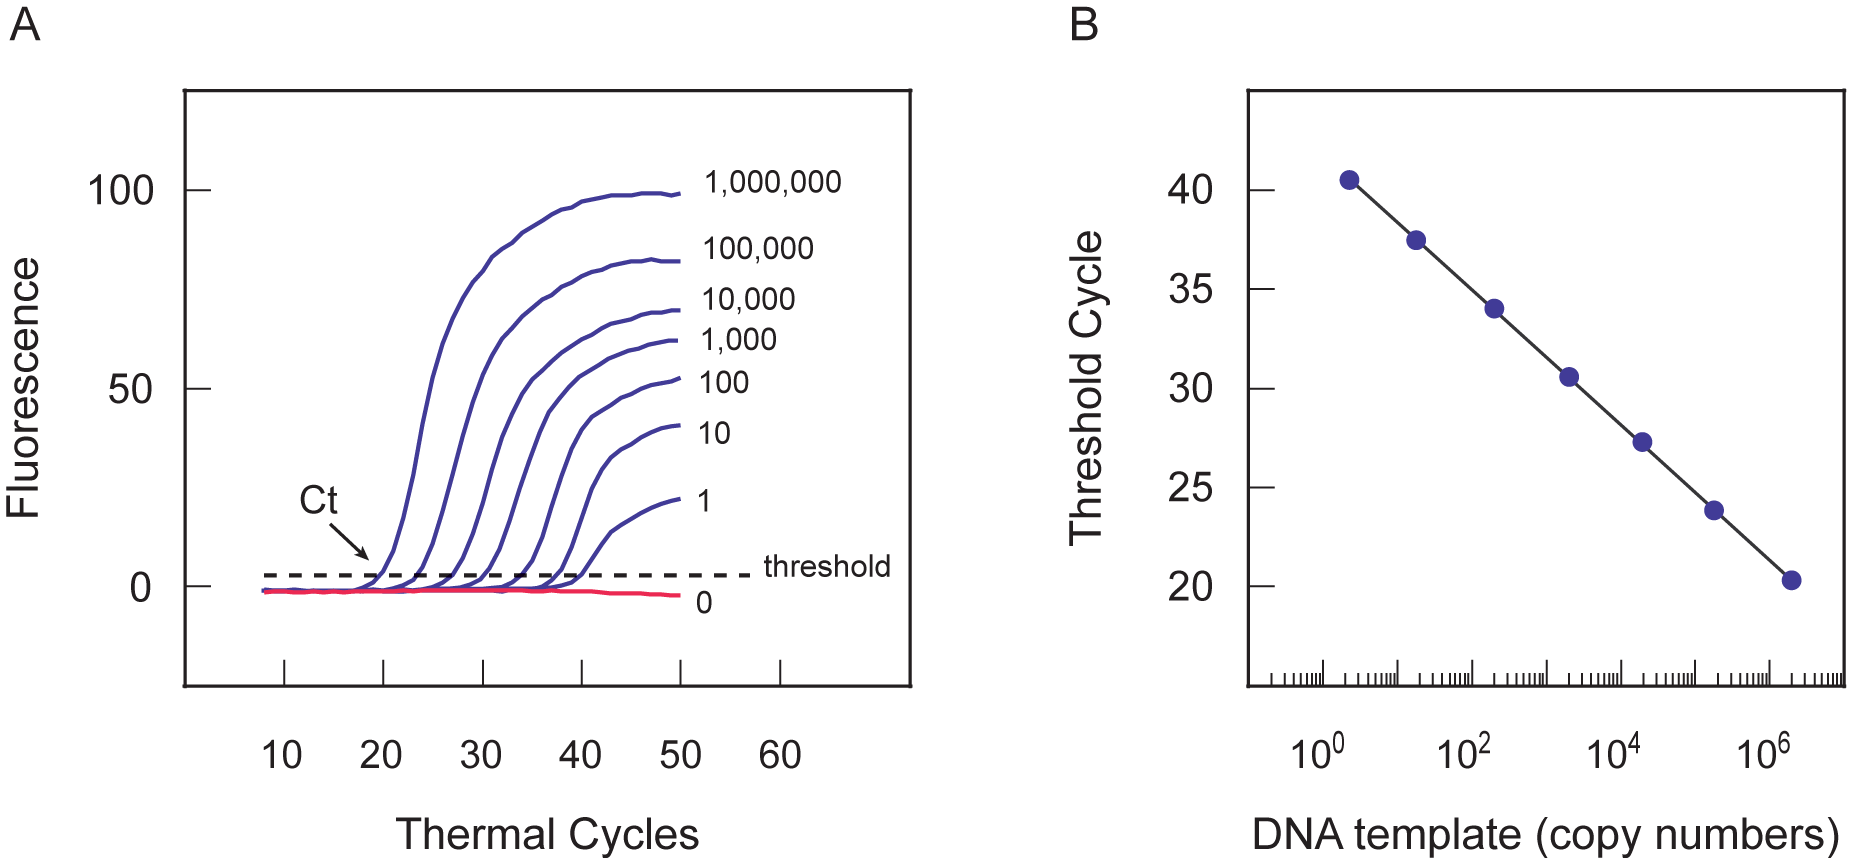
Figure 5. (A) The threshold cycle (Ct) is the cycle at which the fluorescence rises significantly above the background. The fluorescence increases as the molecular beacons bind to the amplification products that accumulate during each successive cycle. In the early cycles of amplification, the change in fluorescence is usually undetectable, but at some point during amplification, the accumulation of amplified DNA results in a detectable change in the fluorescence of the reaction mixture. The threshold cycle number decreases as the number of target molecules initially present in a reaction increases. (B) The standard curve can be used to determine the starting amount of an unknown template, based on its threshold cycle. Given known starting amounts of the target, a standard curve can be constructed by plotting the log of the starting amount versus the threshold cycle. The threshold cycle is inversely proportional to the logarithm of the number of target molecules initially present.
6. Literature
Detailed descriptions on the design, synthesis and application of molecular beacons appeared in:
-
Tyagi S, Marras SAE, Vet JAM, and Kramer FR (2000)
Molecular beacons: hybridization probes for detection of nucleic acids in homogeneous solutions.
In Kessler, C (ed.), Nonradioactive analysis of biomolecules, Second edition.
Springer Verlag, Berlin, Germany, pp. 606-616.
-
Marras SAE, Kramer FR, and Tyagi S (2003)
Genotyping single nucleotide polymorphisms with molecular beacons.
In Kwok, PY (ed.), Single nucleotide polymorphisms: Methods and Protocols.
Humana Press, Totowa, NJ, Vol. 212, pp. 111-128.
-
Vet, J.A.M. and Marras, S.A.E. (2004)
Design and optimization of molecular beacon real-time polymerase chain reaction assays.
In Herdewijn, P. (ed.), Oligonucleotide synthesis: Methods and Applications.
Humana Press, Totowa, NJ, Vol. 288, pp. 273-290.
Recent Publications from our group
Ma MT, Jiang Q, Chen CH, Badeti S, Wang X, Zeng C, Evans D, Bodnar B, Marras SAE, Tyagi S, Bharaj P, Yehia G, Romanienko P, Hu W, Liu SL, Shi L, and Liu D (2024) S309-CAR-NK cells bind the Omicron variants in vitro and reduce SARS-CoV-2 viral loads in humanized ACE2-NSG mice. Journal of Virology: e0003824. PMID: 38767356: PubMed Link
Banada PP, Green R, Streck D, Kurathi R, Reiss R, Banik S, Montalvan I, Jones R, Marras SAE, Chakravorty S, and Alland D (2023) An expanded RT-PCR melting temperature coding assay to rapidly identify all known SARS-CoV-2 variants and sub-variants of concern. Scientific Reports 13. 21927. PMID: 38081834: PubMed Link
Ebraham L, Xu C, Wang A, Hernandez C, Siclari N, Rajah D, Walter L, Marras SAE, Tyagi S, Fine DH, Daep CA, and Chang TL (2023) Oral Epithelial cells expressing low or undetectable levels of human angiotensin-converting enzyme 2 are susceptible to SARS-CoV-2 virus infection in vitro. Pathogens 12. PMID: 37375533: PubMed Link